 World
Water Forum
13 March 2003
The Geneva-based International Federation at the
core of the Forum's Debates promotes the
humanitarian activities of 178 National Red Cross
and Red Crescent Societies among vulnerable
people. By coordinating international disaster
relief and encouraging development support, it
seeks to prevent and alleviate human suffering.
The Federation, National Societies and the
International Committee of the Red Cross
together, constitute the International Red Cross
and Red Crescent Movement.
The World Water Forum which took place 17th-23
March, recognised that during the time-span of
these Debates 48,000 children will have died
because of lack of access to safe drinking water,
inadequate sanitation and poor hygiene, said the
International Federation of Red Cross and Red
Crescent Societies today.
 The Federation secretary
general, Didier Cherpitel said, "It's a
telling statistic in an appalling litany which
includes the fact that four million people die
every year from water-related diseases and one
billion people do not have access to a safe water
supply. This presents a great challenge to
governments and humanitarian organizations like
ourselves in the century ahead." The Federation secretary
general, Didier Cherpitel said, "It's a
telling statistic in an appalling litany which
includes the fact that four million people die
every year from water-related diseases and one
billion people do not have access to a safe water
supply. This presents a great challenge to
governments and humanitarian organizations like
ourselves in the century ahead."
The International Federation is calling on
governments attending the World Water Forum to
ensure meaningful progress is made on the issue
of access to water amidst fears that the numbers
of people living without clean water and adequate
sanitation could rocket to five billion people by
the year 2050.
The International Federation is used the occasion
of the World Water Forum to hold a parallel
meeting of its water and sanitation experts from
around the world. "Our key concern at this
year's meeting is to discuss ways of extending
our community-based programmes particularly in
Africa, Asia and Latin America. We hope to be
able to find new partners for this work at the
Forum," said Uli Jaspers, head of water and
sanitation at the Federation.
Worldwide, the Federation provides impoverished
communities and victims of disasters with 20
million litres of water per day, benefiting
approximately one million people in over 30
programmes at an annual cost of 50 million Swiss
francs.
For further
information,
Denis McClean, Head, Media Service - Tel: + 41 22
730 44 28 / + 41 79 217 33 57
Media Service Duty Phone - Tel: + 41 79 416 38 8
© 2002 International Federation of Red Cross and
Red Crescent Societies
|
PLAIN
FACTS DEBATED
water water everywhere
and not a drop tp drink!
World Water Forum promotes
privatisation and deregulation of world's water
"Today, companies like France's
Suez are rushing to privatize water, already a $400
billion global business. They are betting that H2O
will be to the 21st century what oil was to the
20th." - Fortune Magazine
The privatisation of water has a long and complicated
history, even going back as early as the mid-nineteenth
century when Napoleon III privatised water services in
France. While many municipalities and communities have or
are currently experimenting with different policies
regarding water services, privatised water still accounts
for only 10% of the world's water utilities.However,
water privatisation recently got a big boost at a meeting
of government ministers, representatives from the World
Bank, the United Nations, and CEOs from some of the
world's largest water and water-related corporations.
The 2nd World Water Forum held on March 17-22, 2000 in
Den Haag, the Netherlands provided just the political
impetus these institutions needed to accelerate the
process of global water deregulation and privatisation
further into the corporate sphere.
Making water everybody's 'business'
The World Water Forums are the triennial meetings of the
World Water Council - an international think-tank with
considerable influence in the world of international
water politics. After the 1st World Water Forum in
Marrakech, Morocco in 1997, the World Water Council
initiated its 'vision exercise' known as the "Long
Term Vision for Water, Life and Environment in the 21st
Century" - or "World Water Vision." The
vision exercise, according to World Bank Vice-President
and Chair of the World Water Council, Ismail Serageldin,
was intended to "contribute to changing our world
water future." The title of the vision document
perhaps alludes to the changes Serageldin is referring to
- "World Water Vision: Making Water Everybody's
Business."
To "guide the World Water Vision exercise," in
1998 the Council created yet another entity called the
World Water Commission.This Commission includes some high
profile corporate and neo-liberal personalities
including: Suez Lyonnaise des Eaux Chair Jerôme Monod;
founder of the greenwash body, Business Council on
Sustainable Development (now known as the WBCSD) Maurice
Strong; former World Bank President Robert S. McNamara;
President of the Inter-American Development Bank Enrique
Iglesias; CEO of the World Bank/UN Global Environment
Facility Mohamed T. El-Ashry; and Ismail Serageldin as
Chair.
Skewed vision
The World Water Commission claims that the vision
document is the result of 18 months of an
"extraordinary participatory exercise,"
involving "thousands of men and women." However,
close examination of the Commission's methodology reveals
a different picture. The bulk of input into the vision
exercise came from participants and groups attending the
myriad of water-related conferences over the last 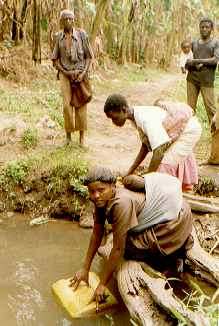 one and a
half years. While these conferences took place in various
parts of the world, the majority of the participants to
such events were mostly technical advisors, academics,
water 'experts' and members of large development agencies
and NGOs. People most directly affected by water crises
around the world were often marginalised in such events.
Urban slum dwellers, rural villagers, people afflicted by
waterborne diseases, victims of World Bank-funded
hydroelectric dam projects or those suffering from floods
and droughts, have had almost no input into the 'vision
exercise'. Yet despite, this, Serageldin refers to the
vision as being reflective of "all
stakeholders." one and a
half years. While these conferences took place in various
parts of the world, the majority of the participants to
such events were mostly technical advisors, academics,
water 'experts' and members of large development agencies
and NGOs. People most directly affected by water crises
around the world were often marginalised in such events.
Urban slum dwellers, rural villagers, people afflicted by
waterborne diseases, victims of World Bank-funded
hydroelectric dam projects or those suffering from floods
and droughts, have had almost no input into the 'vision
exercise'. Yet despite, this, Serageldin refers to the
vision as being reflective of "all
stakeholders."
A
look at "all the stakeholders"
Despite Serageldin's claims of being inclusive of
"all stakeholders," A handful of
organisations controlled and dominated the vision
process. Chief among these were the World Water
Council (WWC), World Commission on Water for the
21st Century (WCW), Global Water Partnership
(GWP), World Bank, and the French water giant
Suez Lyonnaise des Eaux. Key positions in these
organisations were also dominated by only a few
key individuals, such as Ismail Serageldin who
chaired all three water groups and served as Vice
President of the World Bank.[6] No less
than four people from top positions in Suez
Lyonnaise des Eaux held influential positions in
the different groups.[7]Of the 85
individuals and organisations who have
contributed to the December 1999 draft of the
World Water Vision document, only 19 did not have
any direct links to one of the groups driving the
vision process.[8]
|
A free
market 'Framework for Action'???
While the Council and it's offspring, the World
Commission on Water for the 21st Century, provided the
'vision' for the Water Forum, it was left to their sister
entity, the Global Water Partnership to develop and guide
the Framework for Action. This document, suggests actions
that governments should take to implement the Vision. The
report includes some very controversial recommendations
familiar to many who have been following trends in
international trade and investment negotiations.
These include calls
for: full liberalisation and deregulation of the water
sector; 'national treatment' whereby transnational
corporations should be given the same treatment as local
enterprises and/or public authorities; transparency in
government procurement of water contracts; trade
facilitation - where governments should be more
service-oriented to the private sector; and privatisation
as much as feasible with mixed public-private partnership
agreements being the next best thing. Other
recommendations include the removal of all price and
trade distorting subsidies; dispute settlement over water
issues; promotion of agricultural biotechnologies;
protection of property rights over water resources; and
alarmingly reminiscent of the infamous Multilateral
Agreement on Investment (MAI), a demand for a
"stable and predictable investment climate"
which would reinforce "investor rights."
All of the above recommendations and more are detailed in
the Framework for Action, though coloured in terminology
all too similar to the rhetoric traditionally used by
many NGOs. Children's crayon drawings and the many
references to gender, community empowerment, and land
reform, help to paint what are far-reaching proposals to
expand and reinforce corporate power over the world's
water supplies in a more positive and acceptable light.
While some of the proposals outlined in the report, could
potentially be helpful in mitigating global water
problems, they are largely undermined by what Ismail
Serageldin describes as a future with the "private
sector acting as engines of transformation on the
ground."
CEOs take a stand
In the showroom area of the conference (the World Water
Fair), corporations such as Nestlé,
Suez Lyonnaise des Eaux, Unilever, and Heineken showcased
their efforts to promote sustainability and water
efficiency, while their CEOs addressed the assembly demanding that
water be recognised as an economic good rather than as a
human right. In fact, all the
Forum rhetoric focused on human 'needs' as opposed to a
concept of human 'rights', consistent with the World
Water Vision in which the concept of water as a human
right does not appear.
Another ideological victory that was won by the private
sector and neo-liberal minded government officials at the
Forum, was official recognition of the importance of
public-private partnerships (PPPs) in the water sector.
Public-Private Partnerships, whereby government and
industry cooperate on a project (usually a public
service), constitute a small percentage of the makeup of
the world's water management systems. However, in light
of the outcomes of the conference, this may very well
increase in the next few years.
Numerous documents and workshops and individual speeches
throughout the Forum all spoke of the successes of
existing Public-Private Partnership models and the
promises they bring.
Not once was it suggested that governments cannot afford
to invest in their water services, because they are
recovering from financial crises, asphyxiated by
IMF-imposed structural adjustment programmes, and
'cash-strapped' because they are forced to spend a huge
percentage of their annual budgets on servicing debts to
donor countries and multilateral financial institutions.
Activists
challenge the water forum consensus
However, not
all was rosy for the conference organisers. Many
groups did their best to raise a critical voice to the
whole process. In one session on Public-Private
Partnerships, a Filipino member of a public sector union
in Manila, stood up in the audience and displayed a
sample of Manila tap water after one such partnership was
implemented with Lyonnaise des Eaux. The yellow-brown
water held aloft in a small bottle proved to be quite an
embarrassment for Jack Moss, marketing director of
Lyonnaise des Eaux, who had just completed a dry
presentation on the success of the Manila project - one
of the largest water privatisation projects to date.
Some members of Los Solidarios con Itoiz, a group seeking
to stop the construction of the Itoiz dam in the Basque
country, managed to interrupt the opening ceremony with a
well organised action including a banner drop inside the
main hall, a chorus of protest from the audience, and a
'naked truth' action on stage demanding "No Profits
from Water" and "Stop Itoiz Dam". The
protesters were jailed for three days, most likely
because of the embarrassment it caused the Dutch
government and particularly Prince Willem Alexander who
served as convenor for the Forum. Members of Public
Services International, the Council of Canadians, the
Nepal-based International Institute for Human Rights,
Environment and Development, and others also made
numerous interventions throughout the conference, yet
much of what they said fell on deaf ears. It didn't
take long to figure out that the conclusions of the Forum
were not the product of open discussion at the conference,
but were worked out long ago. In that respect, the Forum
itself served more as a high-profile PR event to
highlight those foregone conclusions rather than the
forum for open debate it was promoted to be.
Water, a resource essential to human survival, has long
proven difficult and controversial for corporations, as
recent mass protests in Cochabamba, Bolivia illustrated.
There, people suffering from a dramatic rate hike in
water services after a controversial privatisation
agreement was made between the local municipality and San
Francisco-based Bechtel Corp., refused to accept it. Soon
after it emerged that the privatisation was a condition
placed upon the Bolivian government by the World Bank.
The protests forced the government to reduce the water
rates and re-evaluate the contract with Bechtel, and
sparked off a massive public debate about democratic
decision-making and accountability. The uprising sent a
chill down the spine of Bechtel Corp., and other water
giants keen on penetrating new markets.
However,
with the ideological and political backing of the world's
governments, politicians, and institutions such as the
World Bank and the UN behind them, corporations may now
find things have just become easier.
Some
Water Facts:
·The
underground aquifer that supplies one-third of
the water for the continental US is being
depleted 8 times faster than it is being
replenished.
·Saudi
Arabia is a net exporter of wheat using
non-renewable water reserves. It is expected to
have completely depleted all of its reserves
within 50 years.
·The
manufacture of computer wafers, used in the
production of computer chips, uses up to 18
million litres of water per day. Globally, the
industry uses 1.5 trillion litres of water and
produces 300 billion litres of wastewater every
year.
·Available
fresh water amounts to less than one half of one
percent of all the water on Earth. The rest is
sea water, or is frozen in the polar ice. Fresh
water is naturally renewable only by rainfall, at
the rate of 40-50,000 cubic km per year.
·In
India, some households pay a staggering 25
percent of their income on water.
·Poor
residents of Lima, Peru, pay private vendors as
much as $3 for a cubic meter for buckets of
often-contaminated water while the more affluent
pay 30 cents per cubic meter for treated
municipal tap water.
·More
than five million people, most of them children,
die every year from illnesses caused by drinking
poor-quality water.
·More
than one billion people live in arid regions that
will face absolute water scarcity by 2025.
Sources:
Barlow, Maude, "Blue Gold". Yaron, Gil,
"The Final Frontier". Public Services
International: http://www.world-psi.org, Fortune
magazine, World Water Vision.
|
The UN World Water Development
Report just
released!
Dr. Mahmoud
Abu-Zeid, Egyptian Minister of Water Resources and
Irrigation and President of the World Water Council,
explains: “Increasing scarcity, competition and
arguments over water in the first quarter of the 21 st
century will dramatically change the way we value and use
water and the way we mobilise and manage water resources.
Innovative ways of using this precious commodity have to
be found to protect ecosystems and ensure food for the
billions on this planet.”
For
the first time, 23 United Nations agencies and convention
secretariats have combined their efforts and expertise to
produce the most comprehensive and up-to-date report on
the state of the world's freshwater resources. The World
Water development Report was officially launched at the
occasion of World Water Day, March the 22nd, during the
3d World Water Forum.
 First UN system-wide
evaluation of global water resources First UN system-wide
evaluation of global water resources
Paris - Faced with “inertia at the leadership
level”, the global water crisis will reach
unprecedented levels in the years ahead with
“growing per capita scarcity of water in many parts
of the developing world”, according to a United
Nations report made public today. Water resources will
steadily decline because of population growth, pollution
and expected climate change.
The World Water Development Report
- Water for People, Water for Life - is the most
comprehensive, up-to-date overview of the state of the
resource. Presented on the eve of the Third World Water
Forum (Kyoto, Japan, March 16 – 23), it represents
the single most important intellectual contribution to
the Forum and the International Year of Freshwater, which
is being led by UNESCO and the UN Department of Economic
and Social Affairs.
To
compile the report, every UN agency and commission
dealing with water has for the first time worked jointly
to monitor progress against water-related targets in such
fields as health, food, ecosystems, cities, industry,
energy, risk management, economic evaluation, resource
sharing and governance. The 23 UN partners constitute the
World Water Assessment Programme
(WWAP), whose secretariat is hosted by UNESCO.
“Of all the social and natural crises we
humans face, the water crisis is the one that lies at the
heart of our survival and that of our planet Earth,”
says UNESCO Director-General Koïchiro Matsuura.
Despite widely available evidence of the crisis,
political commitment to reverse these trends has been
lacking. A string of international conferences over the
past 25 years has focused on the great variety of water
issues including ways to provide the basic water supply
and sanitation services required in the years to come.
Several targets have been set to improve water management
but “hardly any”, says the report, “have
been met.”
“Attitude and behaviour problems lie at the heart of
the crisis,” says the report, “inertia at
leadership level, and a world population not fully aware
of the scale of the problem means we fail to take the
needed timely corrective actions”.
Many countries and territories are already in a state of
crisis. The report ranks over 180 countries and
territories in terms of the amount of renewable water
resources available per capita, meaning all of the water
circulating on the surface, in the soil or deeper
underground
The poorest in terms of water availability is Kuwait
(where 10 m³ is available per person each year) followed
by Gaza Strip (52 m³), United Arab Emirates (58 m³),
Bahamas (66 m³), Qatar (94 m³), Maldives (103 m³),
Libyan Arab Jamahiriya (113 m³), Saudi Arabia (118 m³),
Malta (129 m³) and Singapore (149 m³).
The top ten water-rich countries (with the exception of
Greenland and Alaska) are: French Guiana (812,121 m³
available per person per year), Iceland (609,319 m³),
Guyana (316,689 m³), Suriname (292,566 m³), Congo
(275,679 m³), Papua New Guinea (166,563 m³), Gabon
(133,333 m³), Solomon Islands (100,000 m³), Canada
(94,353 m³), New Zealand (86,554 m³).
ENVIRONMENTAL
CAUSES
By the middle of this century, at worst seven billion
people in 60 countries will be faced with water scarcity,
at best 2 billion in 48 countries, depending on factors
like population growth and policy-making. Climate change
will account for an estimated 20% of this increase in
global water scarcity, according to the report. Humid
areas will probably see more rain, while it is expected
to decrease and become more erratic in many drought-prone
regions and even some tropical and sub-tropical regions.
Water quality will worsen with rising pollution levels
and water temperatures.
.POLLUTION
The water crisis “is set to worsen despite
continuing debate over the very existence of such a
crisis,” says the report. About 2 million tons of
waste are dumped every day into rivers, lakes and
streams. One litre of wastewater pollutes about eight
litres of freshwater. According to calculations in the
report, there is an estimated 12,000 km³ of polluted
water worldwide, which is more than the total amount
contained in the world’s ten largest river basins at
any given moment. Therefore, if pollution keeps pace with
population growth, the world will effectively lose 18,000
km³ of freshwater by 2050 – almost nine times the
total amount countries currently use each year for
irrigation, which is by far the largest consumer of the
resource. Irrigation currently accounts for 70% of all
water withdrawals worldwide.
QUALITY
The report ranks 122 countries according to the quality
of their water as well as their ability and commitment to
improve the situation . Belgium is considered the worst
basically because of the low quantity and quality of its
groundwater combined with heavy industrial pollution and
poor treatment of wastewater. It is followed by Morocco,
India, Jordan, Sudan, Niger, Burkina Faso, Burundi,
Central African Republic and Rwanda.
The list of countries with the best quality is headed by
Finland followed by Canada, New Zealand, United Kingdom,
Japan, Norway, Russian Federation, Republic of Korea,
Sweden and France.
“The poor continue to be the worst affected, with
50% of the population in developing countries exposed to
polluted water sources,” says the report. Asian
rivers are the most polluted in the world, with three
times as many bacteria from human waste as the global
average. Moreover, these rivers have 20 times more lead
than those of industrialized countries.
DEMOGRAPHIC
PROBLEMS
“The future of many parts of the world looks
bleak,” says the report, in reference to projected
population growth, which will continue to be a driving
factor in the water crisis. Per capita water supplies
decreased by a third between 1970 and 1990, according to
the report. Even though birth rates are slowing down, the
world’s population should still reach about 9.3
billion by 2050 (compared to 6.1 billion of 2001).
“Water consumption has almost doubled in the last 50
years. A child born in the developed world consumes 30 to
50 times the water resources of one in the developing
world. Meanwhile water quality continues to worsen
[…]. Every day, 6000 people, mostly children under
the age of five, die from diarrhoeal diseases,” says
the report. “These statistics illustrate the
enormity of the problems facing the world with respect to
its water resources, and the startling disparities that
exist in its utilization.” 
GOVERNMENTS
IN CRISIS
Against this background, the report takes an in-depth
look at every major dimension of water use and management
– from the growth of cities to the threat of looming
water wars between countries. A single thread runs
through each section: the water crisis - be it the number
of children dying of disease or polluted rivers - is a
crisis of governance and a lack of political will to
manage the resource wisely.
“Globally, the challenge lies in raising the
political will to implement water-related
commitments,” says the report. “Water
professionals need a better understanding of the broader
social, economic and political context, while politicians
need to be better informed about water resource issues.
Otherwise water will continue to be an area for political
rhetoric and lofty promises instead of sorely needed
actions.”
With more than 25 world maps, numerous charts, graphs and
seven case studies of major river basins, the report
analyzes how diverse societies cope with water scarcity,
including policies that work or don’t work. It lays
the foundations – through the World Water Assessment
Programme - for the UN to regularly monitor and report on
the state of the resource by developing a set of
standardized methodologies, data and indicators.
The report WAS formally presented to the international
community on World Water Day, March 22nd,
during the World Water Forum in Kyoto. A series of
high-level panel discussions WERE organized to discuss
the results.
Chapter highlights:
Health and Economics
“The 21st century is the century in which the
overriding problem is one of water quality and
management,” says the report. More than 2.2 million
people die each year from diseases related to
contaminated drinking water and poor sanitation. Water
vector-borne diseases also take a heavy toll: about a
million people die from malaria each year and more than
200 million suffer from schistosomiasis, known as
bilharzias. “Yet these terrible losses, with the
waste and suffering they represent, are
preventable.” 
The report explains that cultural factors further
complicate the logistical and financial difficulties in
providing adequate sanitation.
If the current level of investment were maintained, all
regions in the world could reach or come close to both
goals, with the exception of sub-Saharan Africa,
according to the report. But “in absolute terms, the
investment needs of Asia outstrip those of Africa, Latin
America and the Caribbean combined.” It is estimated
that the first interventions would cost about US$12.6
billion.
Questions remain as to the source of this investment.
“Financing the Millennium Development Goals will
probably be one of the most important challenges that the
international community will have to face over the next
15 years,” says the report.
The
report outlines debates over water pricing and
privatization. “Although it is considered essential
to involve the private sector in water resource
management,” according to the executive summary of
the report, “it should be seen as a financial
catalyst – not so much as a precondition – for
project development […]. Control of the assets and
the resource should remain in the hands of the government
and users.”
The
report also insists that any privatization or
water-pricing scheme must include mechanisms to protect
the poor. “A disturbing fact is that poor people
with the most limited access to water supply have to pay
significantly more for water.” In Delhi (India), for
example, vendors charge the poor US$4.89 per m³, while
families with piped connections pay just US$0.01,
according to a survey published in the report. In
Vientiane (Lao PDR), vendors charge $US14.68 per m³,
compared to municipal tariffs of US$0.11.
Agriculture
About 25,000 people die every day from hunger, according
to the report. An estimated 815 million people suffer
from undernourishment: 777 million in developing
countries, 27 million in countries in transition and 11
million in industrialized countries.
“The absolute number of undernourished people is
reducing at a much slower rate,” says the report,
despite the fact that “food production is satisfying
the market demand at historically low prices”.
Previous estimates did not distinguish between rainfed
and irrigated crops. By factoring in this distinction,
the report presents more precise projections concerning
the water required to feed the world today and in the
future.
According to these new calculations, another 45 million
hectares will be irrigated by 2030 in 93 developing
countries, where most of the population growth will take
place. About 60% of all land that could be irrigated will
be in use. This will require an increase by 14% of
irrigation water, according to the report.
Of the some 170 countries and territories surveyed, 20
are already using more than 40% of their renewable water
resources for irrigation , “a threshold
used to flag the level at which countries are forced to
make difficult choices between their agricultural and
urban water supply sectors”, says the report.
Another 16 countries use more than 20%, “which can
indicate impending water scarcity. By 2030 South Asia
will on average have reached the 40% level, and the Near
East and North Africa not less than 58%.”
 By contrast, sub-Saharan Africa,
Latin America and East Asia are likely to remain far
below the critical threshold. These regions will see the
bulk of agricultural expansion in the next 30 years. By contrast, sub-Saharan Africa,
Latin America and East Asia are likely to remain far
below the critical threshold. These regions will see the
bulk of agricultural expansion in the next 30 years.
The challenge lies in improving efficiency of land and
water use. Irrigation is extremely inefficient –
close to 60% of the water used is wasted. This will
only improve by an estimated total of 4%. There is a
tremendous need to improve the financing of better
technology and to promote better management practices.
On a more positive note, average grain yields doubled
between 1962 and 1996, from 1.4 to 2.8
tons/hectares/crop. This means that less than half the
amount of arable land is now required to grow the same
amount of grain. “By 2030, it is expected that 80%
of increased crop production will come from higher
yields, increased multiple cropping and shorter fallow
periods,” says the report.
Hardy Corn: Researchers
at the International Maize and Wheat Improvement Center,
known as CIMMYT, one of 16 CGIAR centers, have created
hardy new breeds of tropical corn that can
increase harvests by 40 percent in the tough environments
of the developing world.
New Rice: New, water-saving techniques are being
developed that could save up to 25 percent
of the water now used to grow rice, according to
scientists at two CGIAR centers -- the International Rice
Research Institute (IRRI), based in Manila, the
Philippines, and the
International Water Management Institute (IWMI), based in
Colombo, Sri Lanka.
Durable Wheat -- Researchers have been able to modify
wheat, once mostly restricted to
temperate and subtropical zones, to make it productive
even in hot climates. One main reason for growing wheat
is it requires less water than rice.
“Towards 2050, the world could
enjoy access to food for all,” says the report.
“The fact that 815 million are presently ravaged by
chronic undernourishment is not due to a lack of capacity
to produce the required food, but to global and national
social, economic and political contexts that permit, and
sometimes cause, unacceptable levels of poverty to
perpetuate.”
According to the World Water Development Report:
Using
treated wastewater could ease the water crisis.
Farmers already use this resource for about 10%
of irrigated land in developing countries and
could use more. With proper treatment, it can
actually improve soil fertility.
Food
security is improving globally. Per capita food
consumption in developing countries rose from
2,054 kcal per day in 1965 to 2,681 in 1998.
Pastures
and crops take up 37% of the Earth’s land
area.
About
10% of the world’s irrigated lands have been
damaged by waterlogging and salinization because
of poor drainage and irrigation practices.
Ecology
The report describes a vicious
circle unleashed by growing water demand. By
depleting and polluting rivers, lakes and
wetlands, we are destroying ecosystems which play
an essential role in filtering and assuring
freshwater resources.
In the United States, 40% of water bodies
assessed in 1998 were not deemed fit for
recreational use due to nutrient, metal and
agricultural pollution. Furthermore only five out
of 55 rivers in Europe are considered pristine,
according to the report and, in Asia, all rivers
running through cities are badly polluted. 60% of
the world’s 227 largest rivers are severely
fragmented by dams, diversions and canals leading
to the degradation of ecosystems.
Turning to the animal life of inland waters, the
report says that 24% of mammals and 12% of birds
are threatened. Between 34 and 80 fish species
have become extinct since the late 19th century,
six since 1970. Only about 10% of the
world’s fish species, the majority from
inland waters, have been studied in detail, yet a
third are at risk.
International Conflict and Cooperation 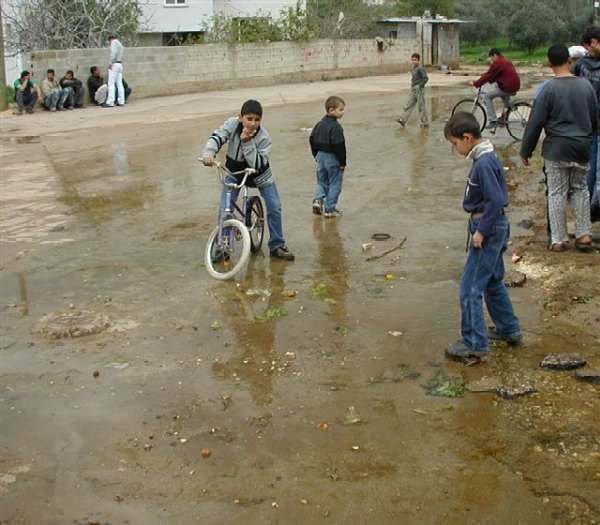
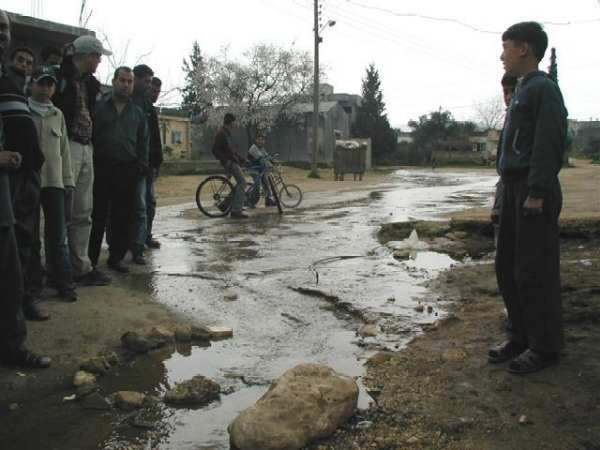
MAIN STREET PALESTINIAN VILLAGE
There is a total of 507 conflictive events. Only
37 involved violence, of which 21 consisted of
military acts (18 between Israel and its
neighbours).
“Some of the most vociferous enemies around
the world have negotiated water agreements or are
in the process of doing so concerning
international rivers,” says the report.
“The Mekong Committee, for example,
continued to exchange data throughout the Viet
Nam War. The Indus River Commission survived
through two wars between India and Pakistan. And
all ten Nile riparian states are currently
involved in negotiations over development of the
basin.”
There are 261 international rivers basins,
involving 145 nations. About one third of these
basins are shared by more than two countries, and
19 involve five or more. According to the report,
a good part of Africa and the Middle East depend
upon these shared resources for more than half
their water supplies as does the southern tip of
Latin America.
GROUNDWATER
(JORDAN VALLEY
EXAMPLE:Renewal of water resources depends on the
overall amount of precipitation and is affected
by temperature, evaporation and transpiration to
plants (evapotranspiration), as well as rates of
runoff and groundwater infiltration (recharge).
On the western side of the Jordan Rift Valley, an
average of approximately 30 percent (%) of the
total precipitation that falls on the region is
usable: 70% is lost through evapotranspiration,
5% is runoff, leaving 25% to recharge
groundwater. On the eastern side of the Jordan
Rift Valley, 90% of the total precipitation is
lost to evapotranspiration, 5% is runoff, leaving
only 5% for groundwater recharge. Of the 5% to
25% that infiltrates to groundwater, a portion
eventually is discharged into streams or springs
which then are classified as surface-water
resources. The remaining infiltrated water is
stored in the ground-water reservoirs (aquifers)
and potentially is available for withdrawal from
wells. )
While much attention has been paid to
international rivers, groundwater supplies
(aquifers) have been largely ignored, despite the
massive volumes of generally high-quality water
involved (estimated at 23,400,000 km³ compared
with the 42,800 km³ in rivers). Many
decision-makers are not even aware that they
share aquifers with other countries. The report
presents the preliminary findings of a UN
initiative to compile the first global map and
inventory of these resources.
It also presents the first map of the
world’s groundwater resources. Aquifers
store as much as 98% of accessible water
supplies. Between 600 to 700 km³ are extracted
each year, providing about 50% of the
world’s drinking supply, 40% of industrial
demands and 20% of irrigated agriculture,
according to the report. These proportions vary
widely from country to country and are presented
in a detailed chart.
Cities
“When infrastructure and services are
lacking, urban areas lacking water infrastructure
are among the world’s most life threatening
environments,” says the report. According to
a survey of 116 cities, urban areas in Africa are
the worst served, with only 18% of households
connected to sewers. The connection rate in Asia
is just over 40%.
“The poor of these cities are the first
victims of sanitation-related disease, flooding
and even a rising rate of water-borne disease
like malaria, which is now among the main causes
of illness and death in many urban areas,”
says the report. In South Asia, for example, the
Anopheles stephensi mosquito has actually adapted
its breeding habits around the ubiquitous rooftop
water storage tankers.
“From a public health perspective,”
says the report, “it is better to provide a
whole city’s population with safe supplies
to taps within 50 metres of their home than to
provide only the richest 20% of households with
water piped to their home.”
The report also outlines several reasons as to
why cities and towns should take priority over
rural areas when choices must be made. First, the
unit costs of the required infrastructure are
lower because urban areas provide significant
economies of scale and proximity. Secondly, many
cities have a more prosperous economic base than
rural areas, providing greater possibilities to
raise revenues for water provision. Thirdly,
“urban areas concentrate not only people and
enterprises but also their wastes.”
Industrial Use
Today industry accounts for 22% of total water
use in the world: 59% in high-income countries
and 8% in low-income countries. The report
predicts that this average will reach 24% by
2025, when industry uses an estimated 1,170
km³/year.
Every year, 300 – 500 million tons of heavy
metals, solvents, toxic sludge and other wastes
accumulate in water resources from industry. More
than 80% of the world’s hazardous waste is
produced in the United States and other
industrial countries.
Natural Disaster Risk
The report outlines the need to make risk
reduction an integral part of water resource
management. While the number of geophysical
disasters like earthquakes and landslides has
remained fairly steady, the scale and number of
water-related events (droughts and floods) has
more than doubled since 1996. During the past
decade, 665,000 people were killed by natural
disasters. Over 90% lost their lives in floods
and droughts. 35% of these disasters occurred in
Asia, 29% in Africa, 20% in the Americas, 13% in
Europe and the rest in Oceania.
Energy
Hydropower is the most important and widely used
renewable source of energy, providing 19% of
total electricity production in 2001.
Industrialized countries are exploiting about 70%
of their electricity potential, compared to 15%
in developing countries, according to the report.
Canada is the largest producer followed by the
United States and Brazil. Untapped
hydro-resources are still abundant in Latin
America, India and China.
“By developing half of this potential, we
could reduce greenhouse gas emissions by about
13%,” says the report. However, it also
points to the many negative impacts of dam
construction, including displacement of local
populations and environmental damage (like loss
of biodiversity and wetlands).
World Water Portal 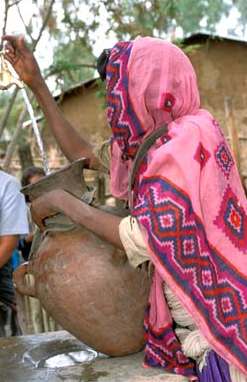
WWAP, together with other partners, is developing
the World Water Portal, to provide seamless
access to a wide body of water information to
decision-makers, water managers, technicians and
the public at large. Before going global, a
prototype water portal has been developed for the
Americas to test ways of sharing information
among local, national and regional water
organizations: http://www.waterportal-americas.org
The Executive
Summary of the UN World Water Development
Report is available online in 7 languages. In
addition to these languages, Chinese and
Bahasa-Malay are expected soon.
Source Unescopress
Contact name Amy Otchet
Contact email a.otchet@unesco.org
For more
details on the water environment and its problems
and challenges, please visit the UNICEF Water ,
Environment and Sanitation website at http://www.unicef.org/programme/wes/
Water is
oxygen within Hydrogen Bonds
Polar molecules, such as
water molecules, have a weak, partial negative
charge at one region of the  molecule (the oxygen atom in
water) and a partial positive charge elsewhere
(the hydrogen atoms in water). Thus when water
molecules are close together, their positive and
negative regions are attracted to the
oppositely-charged regions of nearby molecules.
The force of attraction, shown here as a dotted
line, is called a hydrogen bond. Each
water molecule is hydrogen bonded to four others. molecule (the oxygen atom in
water) and a partial positive charge elsewhere
(the hydrogen atoms in water). Thus when water
molecules are close together, their positive and
negative regions are attracted to the
oppositely-charged regions of nearby molecules.
The force of attraction, shown here as a dotted
line, is called a hydrogen bond. Each
water molecule is hydrogen bonded to four others.
The hydrogen bonds that
form between water molecules account for some of
the essential - and unique - properties of water.
- the attraction
created by hydrogen bonds keeps water
liquid over a wider range of temperature
than is found for any other molecule its
size
- the energy required
to break multiple hydrogen bonds causes
water to have a high heat of
vaporization; that is, a large amount of
energy is needed to convert liquid water,
where the molecules are attracted through
their hydrogen bonds, to water vapor,
where they are not.
Two Outcomes of this:
- the evaporation of
sweat, used by many mammals to cool
themselves, achieves this by the large
amount of heat needed to break the
hydrogen bonds between water molecules
- moderating
temperature shifts in the ecosystem
(which is why the climate is more
moderate near large bodies of water like
the ocean)
The hydrogen bond has
only 5% or so of the strength of a covalent bond. However, when many hydrogen
bonds can form between two molecules (or parts of
the same molecule), the resulting union can be
sufficiently strong as to be quite stable.
Multiple hydrogen bonds
- hold the two
strands of the DNA double helix together
- hold polypeptides
together in such secondary structures as
the alpha helix and the beta conformation
- help enzymes bind
to their substrate
- help antibodies
bind to their antigen
- help transcription
factors bind to each other
- help transcription
factors bind to DNA
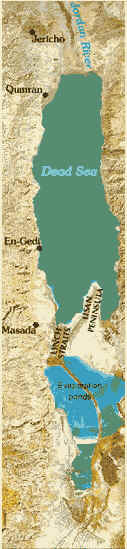 A PROBLEM IN THE MIDDLE
EAST: THE DEAD SEA A PROBLEM IN THE MIDDLE
EAST: THE DEAD SEA
Water levels in the Dead
Sea are dropping rapidly due to declining
rainfall, and an increase in the amount of
irrigation water being taken from the River
Jordan.
Water flows in from the
River Jordan and other sources, but there is no
outflow - it simply evaporates, concentrating the
salts in the water into brine.
In the summer water levels went
below the danger line where it is believed that
salt waters may begin to cause damage to this
lake, its supplies and its ecology. Meanwhile,
demand for water grows.
As Meir Ben Meir, Israel's
Water Commissioner prepared for
retirement(june,2000), he painted a gloomy
picture of possible conflict over water between
Israel, the Palestinians, Jordan and Syria.
"At the moment, I project
the scarcity of water within 5 years," he
says.
"I can promise that if
there is not sufficient water in our region, if
there is scarcity of water, if people remain
thirsty for water, then we shall doubtless face
war."
The Jordan Valley is not
unique. In other ancient water systems - the
Nile, the Tigris and the Euphrates - there is
also a danger of conflict over water.
Overview
of Middle East Water Resources
(1998)
Water is the most
precious and valuable natural (and national)
resource in the Middle East, vital for
socioeconomic growth, sustainability of the
environment, and—when considered in the
extreme—for survival. This publication
presents an overview of Middle East water
resources in areas of Israeli, Jordanian, and
Palestinian interest. Area and site-specific
hydrologic, meteorologic, and geologic data
provided by water-resources agencies of the
region are presented to allow a broad depiction
of the overall water conditions in the region. 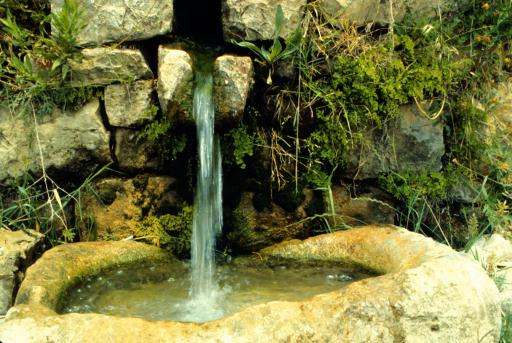
This publication was
developed as part of the Middle East Water Data
Banks Project, which encourages management and
protection of water resources on a regional
basis. Work was completed as a cooperative effort
among the three Core Parties and was coordinated
under the umbrella of the Water Working Group of
the Middle East Multilateral Peace Process. The
participating water-resources institutions are
the Palestinian Water Authority, Jordanian
Ministry of Water and Irrigation, and Israeli
Hydrological Service.
Population
and Water Supply
The available supply of
water varies areally and temporally; and is
influenced by climate, available water-resources
technology, and management practices. Water use
will continue to increase with population and
economic growth and will be further influenced by
the modernization of agricultural practices, as
well as governmental, socioeconomic, and
developmental policies.
The supply of water is
limited to that naturally renewed by the
hydrologic cycle or artificially replenished by
anthropogenic (human) activities. Period-ically,
the amount of natural replenishment can exceed
water demands during unusually wet periods or
fall far below demands during drought periods.
The reality of growing needs for a limited
resource is one of the factors driving water
con-servation efforts and considerations of
alternate water sources.
Renewal of water
resources depends on the overall amount of
precipitation and is affected by temperature,
evaporation and transpiration to plants
(evapotranspiration), as well as rates of runoff
and groundwater infiltration (recharge). On the
western side of the Jordan Rift Valley, an
average of approximately 30 percent (%) of the
total precipitation that falls on the region is
usable: 70% is lost through evapotranspiration,
5% is runoff, leaving 25% to recharge
groundwater. On the eastern side of the Jordan
Rift Valley, 90% of the total precipitation is
lost to evapotranspiration, 5% is runoff, leaving
only 5% for groundwater recharge. Of the 5% to
25% that infiltrates to groundwater, a portion
eventually is discharged into streams or springs
which then are classified as surface-water
resources. The remaining infiltrated water is
stored in the ground-water reservoirs (aquifers)
and potentially is available for withdrawal from
wells.
Water distribution
systems, such as the Israeli National Water
Carrier and the Jordanian King Abdullah Canal,
distribute water from areas of water surplus to
areas of water deficiency.
Total water withdrawal
in the region in 1994 was about 3,050 million
cubic meters (MCM), of which 56% was withdrawn
from wells, 35% from springs and surface-water
sources, and 9% from wastewater reuse and
artificially recharged water. The estimated total
renewable water supply that is practically
available in the region is about 2,400 million
cubic meters per year (MCM/yr). There is then a
water deficit in the region of about 375 MCM/yr
that is being pumped from the aquifers without
being replenished. Available water supply can be
enhanced or expanded to a limited extent by
desalination of brackish or sea water sources,
leak reduction in infrastructure systems, water
awareness and conservation where appropriate, dam
construction and/or enlargement, and the
increased use of treated wastewater.
Climate
Natural replenishment of
water resources in the Middle East varies
greatly, as shown below on the map of average
annual rainfall which exhibits large changes in
relatively small distances across the region. A
Mediterranean-type climate, characterized by a
hot, dry summer and cool winter with short
transitional seasons predominates in the
northern, central, and western parts of the
region. The eastern and southern parts of the
region have a semi-arid to arid climate. Winter
begins around mid-November and summer begins
around the end of May. Rainfall occurs mainly
during the winter months. 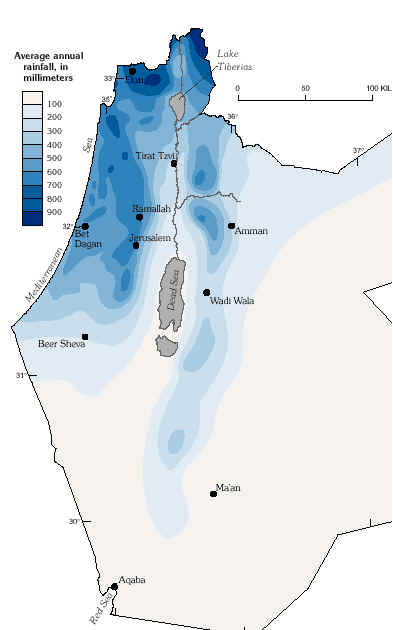
The Middle East
experiences extreme seasonal variations in
climate, as shown below in graphs of average
monthly rainfall, potential evaporation, and
average daily maximum and minimum temperatures
for various locations. Large rainfall variations
also occur from year to year, as shown in the
graph of annual rainfall for Jerusalem.
Consecutive years of relatively high or low
annual rainfall have an enormous effect on the
region and, in the case of dry years, present the
greatest challenge to manage the region's
precious water resources. These consecutive-year
patterns also may affect water-use practices,
policies, and expectations.
Climate characteristics
exhibit large changes from one area to another
and across seasons and years. As shown on the
rainfall map, average rainfall decreases from
west to east and from north to south, ranging
from 1,200 millimeters (mm) at the northern tip
of the region to less than 50 mm in the desert
areas. Rainfall less than 200 millimeters per
year (mm/yr) constrains development of rainfed
agriculture in about half of the area on the
western side, and 90% of the area on the eastern
side of the Jordan Rift Valley.
Temperature also varies
across the area, generally according to latitude
and altitude and by physiographic province (see
next pages for description of provinces). The
hilly areas of the Mountain Belt and Jordan
Highland and Plateau experience cold winters and
hot summers. In Amman and Jerusalem, average
daily mean temperatures for January range from
about 7 to 9 degrees Celsius (°C), whereas, in
summer, the average mean temperature is about 24
°C. Average daily mean temperatures in the
Jordan Rift Valley area range from about about 15
°C in the winter to about
31 °C in the summer. In
the Coastal Plain, average daily temperatures are
between 16 and 22 °C in the winter and between
20 and 31 °C in the summer. The desert region
has a continental climate with a wide range of
temperatures. In August average daily maximum
temperatures are between 34 and 38 °C. In
winter, the air is very cold and dry with an
average daily minimum temperature between 2 and 9
°C. When air from a cold, polar origin
penetrates the region, temperatures decrease to
below the freezing point. The region periodically
experiences very hot days during the spring and
autumn, called Sharav or Khamasini, that may
produce temperature rises from 10 to 20 °C above
average, and reach from 40 to 45 °C in many
areas.
Physical
Geography
(WHAT IS A WATER YEAR?)
The hydrologic year runs from October 1 to
September 30. Year dates in the text of this
report refer to water years, not calendar years.
Coastal Plain
— Located along the Mediterranean Sea, the
Coastal Plain is home to over one fourth of the
region's inhabitants. It is characterized by a
flat topography with a white-sand shoreline,
bordered by fertile farmlands. The Coastal Plain
is formed by the emergent surface of the
continental shelf, consisting of thick
Nile-derived sediments covered by eolian sands of
Quaternary age.
Mountain Belt
— Formed of sedimentary rocks originally
deposited as flat layers that were folded in
southern and central areas. In northern areas,
including the mountains west of Lake Tiberias and
their transverse valleys, the sedimentary rocks
were offset by faulting. The Mountain Belt rises
to elevations from 500 to 1,200 m above sea
level. Cooling of coastal air masses as they rise
over the mountains in northern areas results in
relatively high rainfall.
Negev — An
arid zone that does not support a large
popu-lation. In the northern Negev, Upper
Cretaceous and Tertiary sedimentary rocks were
folded into a northwest-oriented mountain belt.
The central Negev is charac-terized by low
sandstone hills and plains. These highly erodible
areas are deeply incised by wadis which flow
after winter rains and often produce flash
floods. Further south, the region becomes an area
of volcanic craters, rock-strewn plateaus, and
rugged mountains. Several large east-west
oriented faults occur in the Negev.
Jordan Rift Valley
— This dominant physiographic and geologic
feature is a 375-kilometer (km) long strike-slip
fault zone that affects the climate, hydrology,
and anthropogenic activities of the region.
Vertical displacement of the faults of more than
3,000 m resulted in the development of the Hula
Valley, Lake Tiberias, and the Dead Sea. The
elevation of the rift valley drops to about 400 m
below sea level at the present shores of the Dead
Sea, the lowest point on the surface of the
earth. North of the Dead Sea, the valley has long
been used for agriculture because of avaliable
water from the Jordan River and numerous springs
along the flanks of the valley.
Western and Eastern
Escarpments of the Jordan Rift Valley —
Formed as the Jordan Rift Valley deepened,
causing abrupt valley walls and deeply incised
wadis across the escarpments. The area is
characterized by deep canyons that cut through
Upper Cretaceous sedimentary rocks into
underlying rocks of Precambrian to Lower
Cretaceous age.
Jordan Highland and
Plateau — Jordan Highland consists
mainly of deeply-incised Cretaceous sedimentary
rocks that rise to elevations of as much as 1,200
m. These elevations drop gradually eastward
toward the Jordan Plateau, which is characterized
by flat open country with shallow incised wadis
draining inland toward the various depressions.
Basalt flows have markedly smoothed the relief in
parts of the plateau.
South Jordan Desert
— Extremely arid region characterized by
mountains of exposed Paleozoic sandstone, dune
deposits, and exposed Precambrian crystalline
rocks near the Red Sea. Several extensive
northwest-southeast oriented fault occur in this
area.
Groundwater
Groundwater from wells
and springs is the most important source of water
supply in the region, providing more than half of
the total water consumption. Groundwater is
contained in openings in water-bearing rock units
called aquifers. The volume of the openings and
the other water-bearing characteristics of the
aquifers depend on the mineral composition,
texture, and structure of the rocks. Groundwater
generally moves very slowly and follows the least
resistive (most permeable) pathway from the point
of recharge (where water enters the aquifer) to
the point of discharge (where water leaves the
aquifer). Shallow groundwater generally moves at
rates up to one meter per day or greater. An
exception is in aquifers that have conduit-like
openings, such as basalt and karstic (cavernous)
limestone, where water may move much faster.
Deeply circulating groundwater moves extremely
slowly—sometimes as little as a meter or
less per century.
The flow of groundwater
may be inhibited by non-water bearing rock units
called aquicludes. Aquicludes typically consist
of clay, silt, or shale which do not transmit
water readily, although they may hold much water
in pore spaces. Aquicludes influence patterns of
flow in aquifers by restricting groundwater
movement. Confined aquifers occur where an
aquifer is filled by water and is overlain by an
aquiclude. Unconfined aquifers occur where an
aquifer is not overlain by an aquiclude. Geologic
structure (lithology) also controls flow patterns
in aquifers, either by providing barriers
restricting flow or by providing a less-resistive
pathway for flow. The geologic structure and
topography determines if the groundwater will be
discharged as springs or remain underground until
tapped by wells.
The importance of an
aquifer as a source of water may change from one
area to another because of changes in demands for
freshwater, variations in groundwater quality,
and differences in the hydrogeologic
characteristics. Lithologic changes in a
formation may result in its being an aquifer in
some locations and an aquiclude in others. The
most productive aquifers of the region are in
Quaternary sand and gravel in the Coastal Plain;
Cretaceous limestone in the Mountain Belt,
eastern and western escarpments of the Jordan
Rift Valley, and Jordan Highland; basalt of the
Jordan High-land and Plateau; and sandstone of
the South Jordan Desert. Other aquifers include
water-bearing zones of limestone and sandstone of
lower productivity. Water occurs in pore spaces
in the sand and gravel, pore spaces and cavernous
zones in the limestone and sandstone, and in
fractured zones in the basalt.
Freshwater supplies may
be obtained from wells drilled to shallow depths
in the Coastal Plain and Jordan Rift Valley; and
from deeper wells (as much as 650 m) in the
Mountain Belt, Jordan Highland and Plateau, and
the desert regions. Generally, water depths are
greatest in the mountain ranges and desert
regions, and shallowest in valley floors and in
the Coastal Plain.
In addition to wells,
springs provide a source of water supply from
aquifers and form the headwaters of many streams
and wadis. Springs occur where the water table
intersects the surface topography and are common
where geologic structures, such as faults,
provide an outlet for groundwater discharge.
Springs represent visible discharge from
aquifers; invisible or concealed discharges
include seepages, evaporation, transpiration to
plants, and hidden springs. Under natural
conditions, aquifers discharge water in an amount
proportional to total annual infiltration
(recharge).
Groundwater
Basins
Groundwater resources of
the region are subdivided into groundwater basins
on the basis of:
- a natural boundary
that does not change with time, such as
one determined by structural features,
intervening layers, or aquifer extent;
- a boundary that may
change with time, such as an underground
watershed or groundwater divide which may
change in response to pumpage or
recharge; or
- a boundary
designated solely for administrative or
operative reasons.
Although many basins
have been designated by the various
water-resources institutions in the region, in
this report groundwater resources are generalized
into 20 basins solely on the basis of
hydrogeological factors. These include
ground-water divides of the most important
regional aquifer system, the limits of an
aquifer, or important physiographic features.
The natural boundaries
of one aquifer will not coincide with those of
another aquifer. Thus, a basin may contain
several aquifers of different ages and areal
extent occurring at different depths.
Groundwater
Recharge
Although a rock
formation may have properties favorable for
storage of water, it must be in contact with a
source of water for replenishment (recharge) to
provide a continual supply of water. Groundwater
is derived from two origins: (1) fossil, which
receives no or only a very small amount of
recharge; or (2) recent and renewable.
Fossil aquifers are
non-renewable and are found mostly in the
southern and eastern parts of the region. Water
probably infiltrated the fossil aquifers tens of
thousands of years ago, when the prevailing
climate was more humid. Because water pumped from
fossil aquifers is not replenished, groundwater
levels show a continual decline as the water is
"mined" from beneath the ground.
Recent and renewable
recharge is derived naturally from precipitation,
or from streams, wadis, lakes, ponds, or other
impoundments that seep through soil into the
aquifers. In addition, recharge may be induced by
anthropogenic activities that are intentional,
such as injection wells or seepage ponds, or
unintentional, such as irrigation seepage,
wastewater infiltration, or pipe leakage.
Estimates of annual
ground-water recharge for the 20 groundwater
basins were derived by the various
water-resources agencies of the region and are
illustrated below. Estimates were determined by
summing all points of discharge, with the
assumption that this sum equals aquifer recharge.
For each groundwater basin estimated recharge
includes:
- discharge into
surface runoff, including measured spring
discharge and estimated discharge into
surface-water bodies;
- pumped discharge
from wells (measured);
- evapotranspiration
(roughly estimated from regional setting
and estimation from other areas); and
- underground outflow
to adjacent basins.
Recharge is generally
highest in the mountainous northern part of the
region where precipitation is greatest. The
percentage of annual precipitation recharging the
aquifers is dependent on the rates of
evaporation, transpiration to plants, runoff, and
soil permeability.
Groundwater
Quality
Groundwater quality can
be affected by both natural and anthropogenic
activities. In aquifers unaffected by human
activity, the quality of groundwater results from
geochemical reactions between the water and rock
matrix as the water moves along flow paths from
areas of recharge to areas of discharge. In
general, the longer groundwater remains in
contact with soluble materials, the greater the
concentrations of dissolved materials in the
water. The quality of groundwater also can change
as the result of the mixing of waters from
different aquifers. In aquifers affected by human
activity, the quality of water can be directly
affected by the infiltration of anthropogenic
compounds or indirectly affected by alteration of
flow paths or geochemical conditions.
Contamination of fresh
groundwater by saline water is a common problem
in the region. Salinity of groundwater generally
is measured in terms of total dissolved solids or
dissolved chloride. In humid areas and where
recharge is abundant, potential groundwater
salinization is limited because of the natural
flushing by freshwater. Conversely, in semiarid
areas, the absence of natural flushing by
freshwater enhances the accumulation of salts and
saline water. Natural sources of saline water
include:
- encroachment of sea
water near the Mediterranean Sea and Red
Sea;
- upward migration of
highly pressurized brines in the Jordan
Rift Valley and other areas; and
- subsurface
dissolution of soluble salts originating
in rocks throughout the region.
East of the Jordan Rift
Valley and Wadi Araba, water at depths of a few
hundred meters below land surface generally is
saline. Within these areas of generally high
salinity, it is possible that a local source of
acceptable, relatively fresh water exists. Heavy
pumping in some areas has led to water-level
declines and changes in flow directions in the
aquifers. In some cases, this has induced saline
water from the sea or deep brines, to move into
and contaminate an aquifer.
In addition to natural
sources, groundwater quality can be affected by
agricultural, municipal, and industrial
activities in the recharge zone of the aquifer.
Potential sources of contamination include
recycled irrigation water, wastewater from human
activities, and waste by-products from industrial
activities. Nitrate is an important constituent
in fertilizers and is present in relatively high
concen-trations in human and animal wastes. In
general, nitrate concentrations in excess of a
few milligrams per liter indicate that water is
arriving at the well from shallow aquifers that
are polluted from human or animal waste, or from
excess nitrates used in agriculture.
Water-quality changes for selected groundwater
basins are described in the following sections.
Groundwater
Levels
Changes in water levels
in wells reflect changes in recharge to, and
discharge from an aquifer. Recharge rates vary in
response to precipitation, evaporation,
transpiration by plants, and surface-water
infiltration into an aquifer. Discharge occurs as
natural flow from an aquifer to streams or
springs, as evaporation and transpiration from
the shallow water table, as leakage to vertically
adjacent aquifers, and as withdrawal from wells.
Where water-level changes are due to withdrawals,
they also may reflect changes in groundwater flow
direction. Water-level changes for selected
groundwater basins are described in the following
sections.
Springs
Springs have been used
for thousands of years as an important source of
water supply in the region. Springs are places
where groundwater discharges through natural
openings in the ground and are common in areas of
cavernous limestone or basalt. Springs may vary
greatly in the volume of water they discharge;
some springs are so small that they occur only as
seeps where water oozes slowly from the aquifer,
whereas others, such as the Dan Spring, are large
enough to form the headwaters of large streams.
Springs flowing from water-table aquifers tend to
have small, extremely variable flows and are
influenced greatly by climatic conditions. Such
springs may cease flowing during periods of low
precipitation. Springs issuing from confined
aquifers have larger and more consistent flows,
and show less influence from climate than do
water-table springs.
Springflow is controlled
by the size of the recharge area, the difference
in altitude between the spring opening(s) and the
water level in the aquifer, and the size of the
opening(s) through which the spring issues. In
addition, climatic conditions and pumping of
wells located near the spring may influence
flows.
Flow characteristics of
selected springs are presented on the following
three pages in graphs showing annual flow volume
and statistical summaries of monthly flow volume
based on the period of record. Quality of spring
water is indicated by graphs showing chloride and
nitrate concentrations.
 Surface Water Surface Water
Surface water in most of
the region drains to the Mediterranean, Red, or
Dead Seas. In the large desert watersheds, most
streams flow only in response to storms and drain
internally, the water evaporating or infiltrating
the ground. Surface water is very limited in the
region because of generally low rainfall and high
evapotranspiration. However, nearly all of the
available, fresh surface water is used and
together with springs supply about 35% of total
water use in the region. Streamflow
characteristics change rapidly across the region
and closely follow precipitation patterns. Annual
streamflow generally declines from west to east
with distance away from Mediterranean moisture
sources, and from north to south with increasing
temperature and evaporation. Streamflow typically
is higher on the western side of the Mountain
Belt, due to temperature and orographically
induced precipitation, and decreases on the
eastern side of the Mountain Belt descending into
the Jordan Rift Valley.
Watersheds
Watershed size is a poor
indicator of relative flow because of the extreme
differences in climate across the region. Few
streams outside the Jordan River watershed have
adequate baseflow from ground-water and springs
to flow throughout the year. Many streams of the
Mediterranean and Dead Sea watersheds flow
throughout the rainy season and are dry during
the summer. Streams of the Wadi Araba and Desert
watersheds typically flow only in response to
winter storms. Peak flows typically occur during
February and March, lagging the peak
precipitation period by about one month. This lag
time is due principally to the balancing of
extreme moisture deficits in parched soils and
plants after the dry season. Flood events may
also occur following intense storms in the spring
and fall months.
The Mediterranean
watershed includes the Coastal Plain and parts of
the Mountain Belt and Negev. The streams
generally have small watersheds with headwaters
in the western mountains. Many of the streams are
affected by water supply diversions and
wastewater discharges.
The Jordan River
watershed has the largest water yield in the
region and provides most of the usable
surface-water supply. The annual flow volume of
the upper Jordan River above Lake Tiberias is
about three times greater than the combined
annual volume of the streams in the much larger
Mediterranean watershed. The Jordan River
watershed is in the Mountain Belt, Jordan Rift
Valley and Escarpments, and the Jordan Highland
and Plateau. The largest tributary to the Jordan
River is the Yarmouk River, which is the
principal surface-water resource for Jordan. The
Jordan River is perennial throughout its course,
but its flow downstream from Lake Tiberias is
substantially reduced in quantity and quality.
The Dead Sea watershed
includes streams with headwaters in the eastern
side of the Mountain Belt, the Eastern and
Western Escarpments of the Jordan Rift Valley,
and the Jordan Highland and Plateau. The larger
of these streams, such as the Wadi Wala and Wadi
Mujib, flow perennially during their steep decent
into the lowest point on the surface of the
earth.
The North and South Wadi
Araba and the Red Sea watersheds contain
ephemeral streams that typically flow only during
winter storms that may cause dangerous flash
floods in the deeply incised wadis. The
watersheds are in the Negev, the Jordan Highland
and Plateau, the Jordan Rift Valley and Eastern
Escarpment, and the South Jordan Desert. Near the
mouth of the Hiyyon River lies the internal
divide of the Wadi Araba from which water flows
north to the Dead Sea or south to the Red Sea.
Large parts of the
Jordan Highland and Plateaus and the South Jordan
Desert physiographic provinces are characterized
by Desert watersheds that drain internally.
Stormwater flows in these streams generally
decrease in the downstream direction as water is
lost through evaporation and infiltration. The
stream courses of the El Jafr watershed provides
a vivid example of this.
The following pages
describe the flow characteristics of selected
streams in the region.
Dead Sea
The Dead Sea is the
terminal lake of the Jordan Rift Valley. It is
the lowest point on the surface of the earth, and
the waters have the highest density and salinity
of any sea in the world. The east and west shores
of the Dead Sea are bounded by towering fault
escarpments that form part of the African-Syrian
rift system. The valley slopes gently upward to
the north along the Jordan River, and to the
south along the Wadi Araba. Historically, the
Dead Sea is composed of two basins: the principal
northern one that is about 320 m deep (in 1997),
and the shallow southern one from which the Dead
Sea has retreated since 1978. The two basins are
divided by the Lisan (or Lashon) Peninsula and
the Lynch Straits, which has a sill elevation of
about 400 m below sea level.
The closed watershed of
the Dead Sea is 40,650 km2 . Most of the water
flowing to the Dead Sea comes from the relatively
high rainfall areas of the Jordan River watershed
to the north, and the rift valley escarpments to
the east and west of the Dead Sea. To the south,
the Wadi Araba watershed covers the arid regions
of the Negev and South Jordan Desert. The climate
in the watershed varies from snow capped Mount
Hermon (Jabel El Sheik), with annual
precipitation in excess of 1,200 mm, to the arid
regions of the southern Negev, where annual
rainfall averages less than 50 mm. Over the Dead
Sea itself, average annual rainfall is about 90
mm and the annual potential evapotranspiration is
about 2,000 mm. Actual evaporation ranges from
about 1,300 to 1,600 mm and varies with the
salinity at the surface of the Dead Sea, which is
affected by the annual volume of freshwater
inflow. The average temperature is about 40 °C
in summer and about 15 °C in winter.
The water level of the
Dead Sea has a seasonal cycle. Prior to
development of water resources in the watershed,
the peak water level occurred in May and the low
occurred in December, as shown for the period
1935-55 in the bottom graph on the next page.
Within-year variation ranges from 0.3 to 1.2 m
for most of the period of record. Intensive
development of freshwater in the Dead Sea
watershed has altered the seasonal variation in
water level, typically increasing the decline and
decreasing the rise.
The water level of the
Dead Sea has been monitored continuously since
1930, and has declined over 21 m from 1930 to
1997. Such a large decline raises questions of
whether there are precedents for this water-level
change and whether they can be explained by
normal vari-ances in climate. Fortunately,
evidence of histori-cal Dead Sea water-level
changes may be found from several independent
sources.
METHOD
OF RECONSTRUCTING HISTORICAL DEAD SEA
WATER LEVEL
Over
1000 years of historical water-level
records were reconstructed using evidence
from rainfall
and tree ring widths, sedimentology,
history, archeology, botany, and
morphology.
Tree
ring and rainfall evidence: Periods
of wider or narrower average width of the
tree rings of a Juniperus phoenica (cut
and measured in 1968) were found to
correlate well with periods of rising or
falling average rainfall in the watershed
for the period 1846-1968, when concurrent
rainfall records were available. Based on
this correlation, changing average ring
widths for a period extending back
to A.D. 1115 were evaluated and found to
agree with other indicators of Dead Sea
water level.
Sediment
evidence: Aragonite, a calcium
carbonate mineral, precipitates directly
from Dead Sea waters at its surface, and
leaves a crust that becomes a thick
stripe where the level is steady for
several years. Aragonite stripes form a
definite record of historical Dead Sea
water levels, and may
be date-associated where they occur on
archeological ruins, such as Qumran at
about 330 m below sea level. At several
lower elevations, the aragonite stripes
are thick and composed of several layers,
indicating recurring steady Dead Sea
water levels. Intervals between these
stripes are evidence of the steep rise or
fall in water level during rainy or
drought periods.
History
and archeology: Periods of
habitation and abandonment of many
archeological sites
along the western shore of the Dead Sea
were dated according to concurrent
history, coins, pottery, and ruins.
Plotting these sites according to their
chronology and elevation, various points
on the historical hydrograph were
confirmed. History records periods when
the Dead Sea could be forded
on the sill (400 m below sea level) of
the Lynch Straights in the early 19th
century, and in the 18th, 17th,and 14th
centuries. History also records periods
of extreme drought or abundant harvests.
Reference:
Klein, C., 1985, Fluctuations of the
level of the Dead Sea and climatic
fluctuations in the country during
historical times: International
Asso-ciation of Hydrological Sciences,
Symposium, Scientific basis for water
resources management, September, 1985,
Jerusalem, Israel, p. 197-224.
|
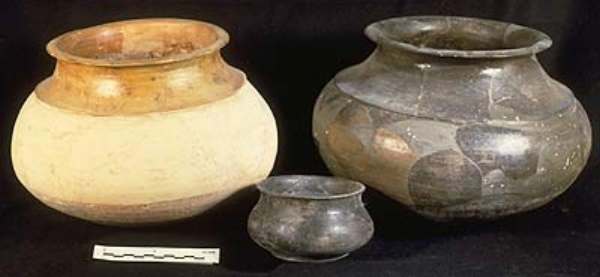
Historical
water-level records of the Dead Sea have been
reconstructed for a period of over 1,000 years,
including the very large rise and fall in water
level around the first century B.C. (modified
from C. Klein, 1985).
As shown above, there are many precedents in the
historical record of larger, more rapid
water-level changes than the 21 m decline over
the last seven decades. Furthermore, the
historical range of water-level fluctuations is
about 83 m, nearly four times the 21 m decline in
this century. Should further water-level declines
reveal submerged trees, or should traces of
historical submergence be found at elevations
higher than 330 m below sea level, the historical
range would increase.
The largest change in
water level shown on the estimated historical
hydrograph occurred between about 100 B.C. and
A.D. 40. Within this period, the water level of
the Dead Sea rose some 70 m, from about 400 m to
about 330 m below sea level (where Qumran was
inundated) in about 67 years; and subsequently
fell some 65 m in about 66 years. A second large
rise, not shown on the graph, occurred between
A.D. 900 and 1100 and crested at about 350 m
below sea level. Could these extreme changes in
stage be explained by climate fluctuations?
The surface
area of the Dead Sea is known to have varied
between about 1,440 km2 at its historical high of
about 330 m below sea level, and about 670 km2 at
410 m below sea level, a greater than twofold
difference. There is a corresponding difference
in the volume of water lost to evaporation each
year.
To address this
question, investigators have made computer
simulations of increased rainfall and runoff in
the Dead Sea watershed, accounting for
evaporation losses. These simulations indicate
that rapid water-level changes on the order of 70
m over a 67-year period could occur if inflow
increased by 33 to 48% over an average inflow
condition. Likewise, persistent years of below
average rainfall could cause rapid declines in
the water level. Historical references lend
weight to this conclusion. There are historical
references to abundant harvests during the period
of the rising Dead Sea water level prior to about
67 B.C., and there was severe drought during the
period of the falling Dead Sea water level
recorded by Josephus Flavius for 25-24 B.C. when
Herod had to sell his treasures in order to buy
corn from Egypt for the population.
The Dead Sea balances
increased inflows not only by a rise in water
level but also by increased evaporation losses.
As the water level of the Dead Sea rises, its
surface area increases causing a corresponding
increase in the volume of evaporated water. The
greater than twofold increase in surface area
between the elevations of 410 and 330 m below sea
level would increase the annual volume of
evaporated water from 1,005 to 2,160 MCM,
assuming a constant annual evaporation of 1,500
mm per year. Evaporation during periods of high
water level is further accelerated by the
dilution of saline waters near the surface,
because in reality evaporation is not constant
but increases as salinity decreases.
Long-term fluctuations
of the Dead Sea water level are caused by
periodic fluctuations in rainfall over the
watershed. The year-to-year water level is steady
when the volume of water leaving the Dead Sea by
evaporation is equal to the volume flowing in
from perennial streams, flash floods in the
wadis, and springs and seeps draining the
groundwater. The water level rises following
seasons of abundant rainfall and declines during
drought years, as shown above in the graph of
water level and rainfall from 1850 to 1997. In
this graph, rainfall patterns in Jerusalem are
assumed to be indicative of Mediterranean- based
rainfall patterns over the Dead Sea watershed.
When the annual rainfall is above average for
several years, there is a cumulative effect
(shown in the cumulative departure curve) leading
to a rise in water level, such as occurred from
about 1882 to 1895. The cumulative effect of
below average rainfall periods leads to declining
water levels as seen in 1930-36, and 1954-63.
Effects of
Development of Water Resources on Dead Sea Water
Level
During the last four
decades, water resources in the Dead Sea
watershed have been intensively developed to meet
growing demands for this precious resource.
Increasing amounts of water were diverted from
surface and groundwater sources in the watershed
to meet domestic, agricultural, and industrial
needs. Since 1964, only a fraction of the flow
from the water-rich areas of the upper Jordan
River leave Lake Tiberias to move toward the Dead
Sea. Most of this water and water from the
Yarmouk and Zarqa Rivers is diverted for uses
inside and outside the watershed. Under current
conditions on an average annual basis, the
combined inflow from all sources to the Dead Sea
has been estimated as only one-half to one-fourth
that of the inflow prior to development. Water
also is pumped from the Dead Sea itself into
evaporation ponds constructed in the shallow
southern basin.
The influence of
rainfall and water-resources development on Dead
Sea water levels is illustrated in the graph
above. Until around 1970, Dead Sea water levels
and rainfall showed a correlation. For example, a
falling trend in Dead Sea water levels during
1954-63 corresponds to a period of below-normal
rainfall. This downward trend was interrupted by
above-normal rainfall that produced a rise in
water levels during 1964-69. Since about 1970,
however, the historical correlation between
rainfall and Dead Sea water levels appears to
deviate. Although rainfall generally increased
during this period, water levels declined
steeply, corresponding to decreased inflows from
the Jordan River. Although the effects of rainy
years in 1980, and especially 1992, are still
evident, their influence on Dead Sea water levels
is moderated. Development of water resources will
result in a more pronounced impact of droughts on
Dead Sea water levels. Thus, Dead Sea water
levels continue to offer a record of the
integrated effects of historical climate and
water-resources development in this watershed.
Source: U.S. Geological
Survey, Water Data
Banks Project, Multilateral Working Group on
Water Resources, Middle East Peace Process
pictures
COPYRIGHT - WHO / P. VIROT
|